Analyze an image stack
[1]:
import astro3d
from astro3d import image_stack
Read the image stack
We again need to set the printer-specific settings and the directory of the slides:
[2]:
stack = image_stack.IStack(
    astro3d.get_output('LocalBoxnoweb'),
    dpi_x=600, dpi_y=300, dz=27e-4,
)
Print out statistics
[3]:
stack.show_colors()
getting colors from 10 sample images ... Done!
[3]:
(<Figure size 400x100 with 1 Axes>, <Axes:>)

Now we assign the transparent color index
[4]:
stack.empty_indices = [2]
[5]:
stack.show_info()
There are 4 colors in this image:
- [0, 0, 0]
- [0, 0, 255]
- [128, 128, 128] (transp.)
- [255, 0, 0]
858 files
dimension = 10.16 x 10.16 x 2.32 cm
filling fraction: 0.25%
nr of fully transparent columns: 0.05%
most opaque pixel has 45 filled pixels (=5.24% of all layers are filled)
mean counts in non-transparent columns: 3.3, 2.5, 8.6e+02, 1.6
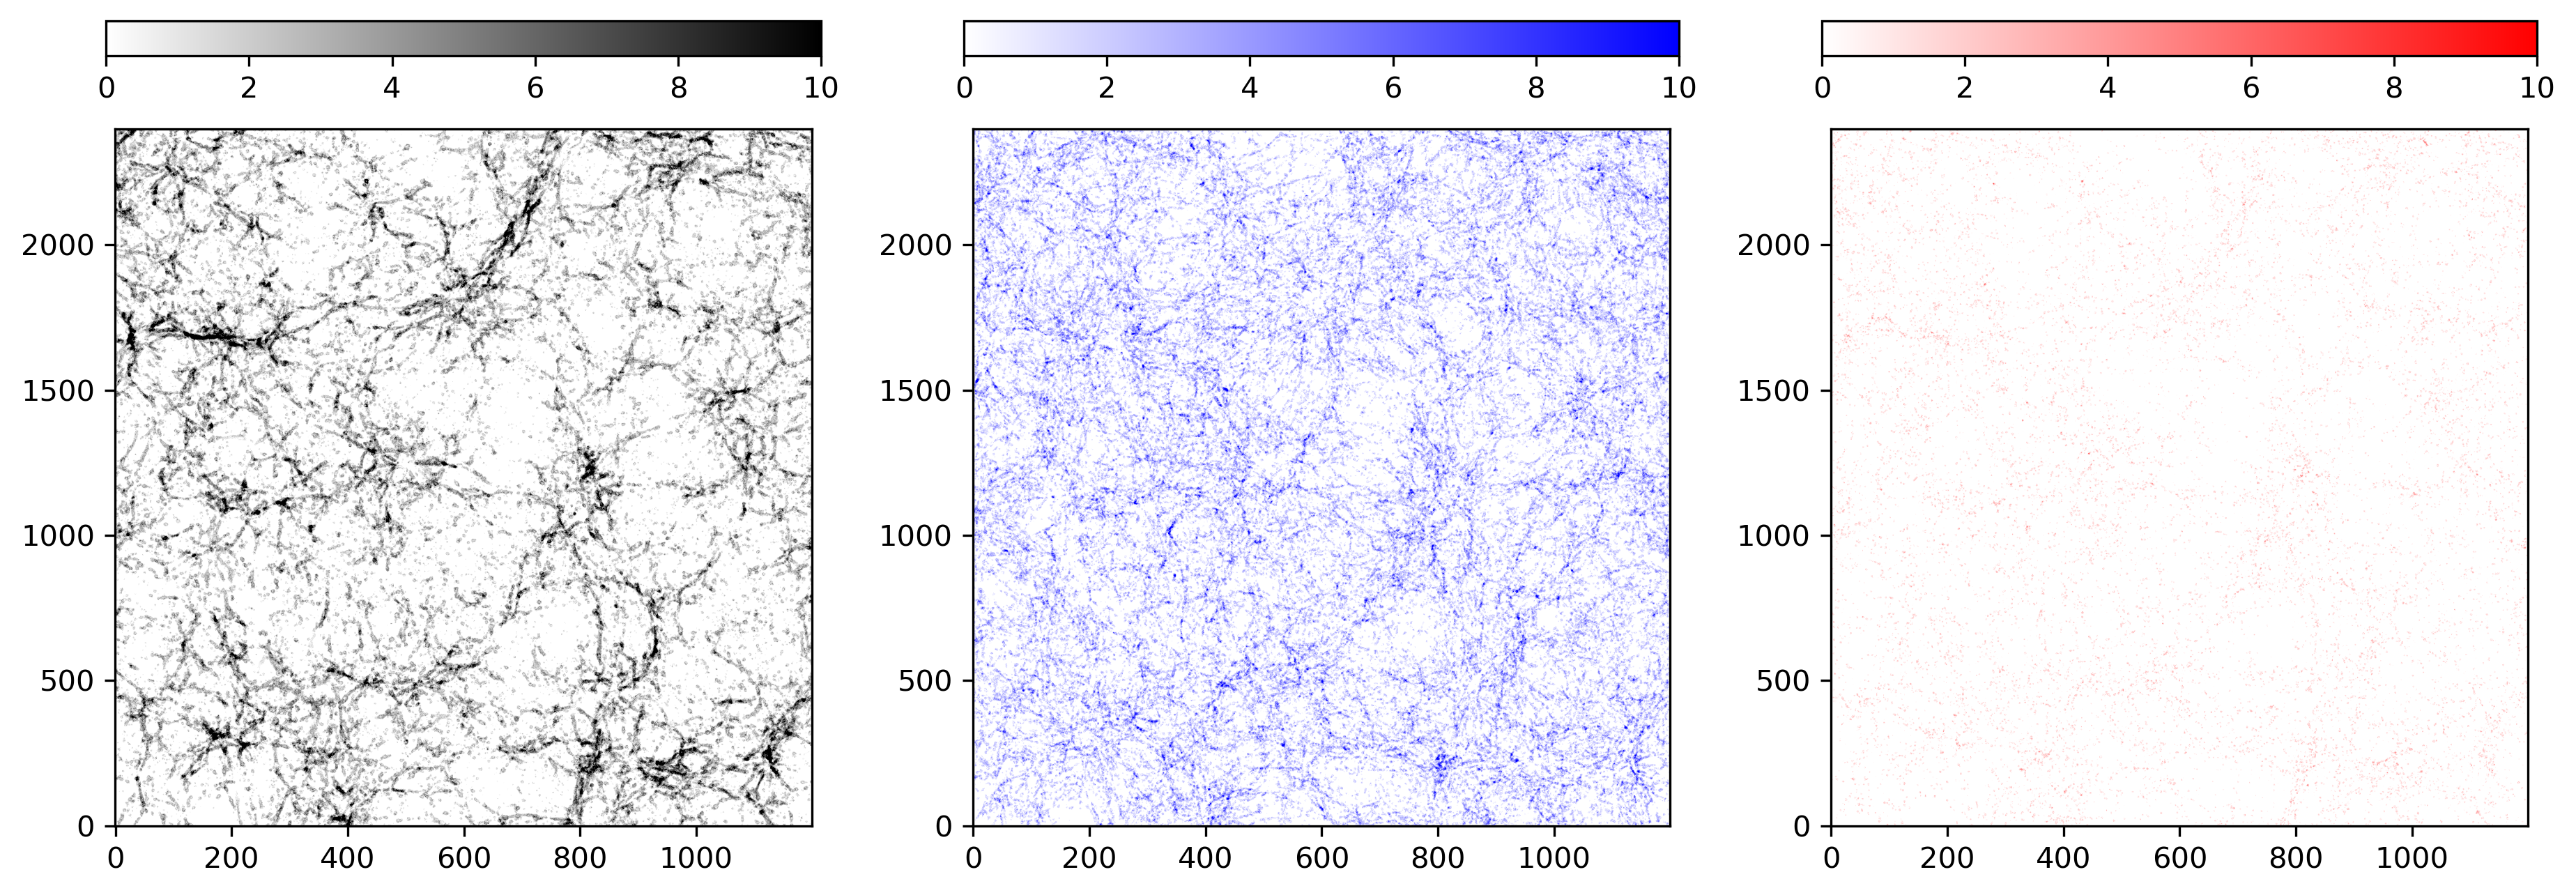
Plots
Show the distribution of materials
[6]:
f, ax = stack.show_counts()

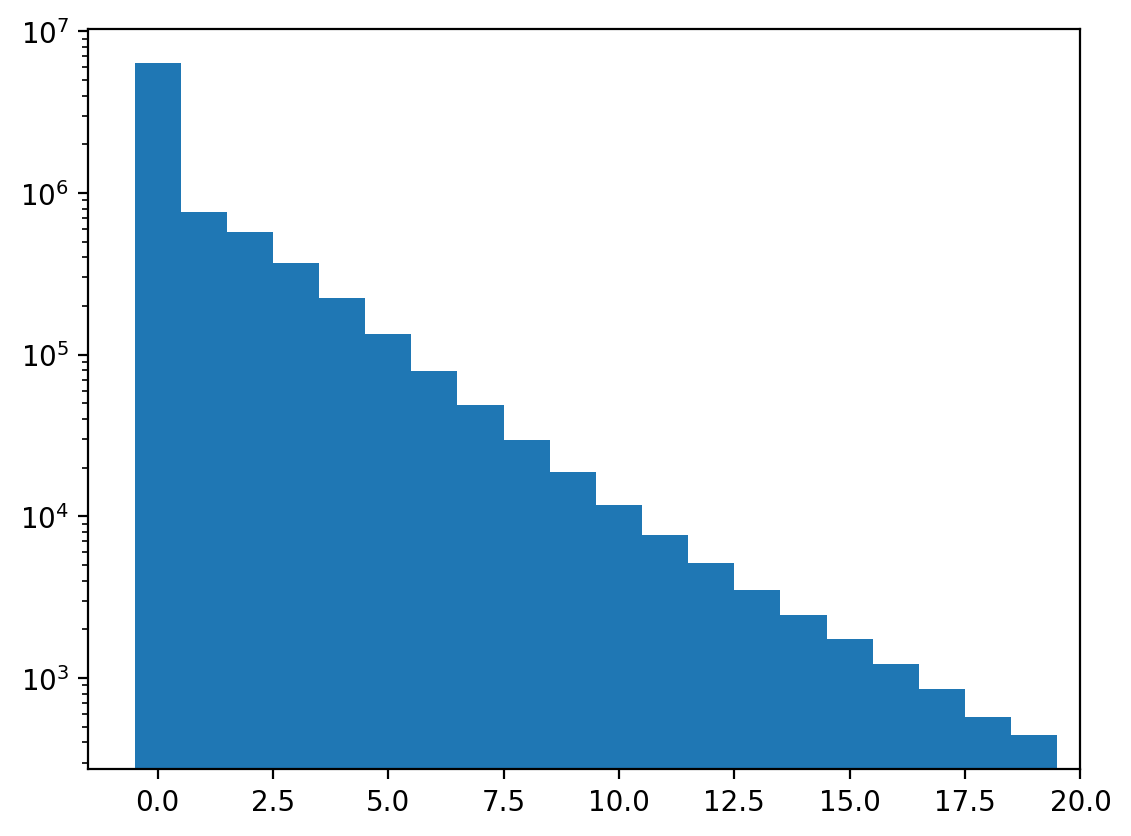
Show a histogram of the columns that are not fully transparent
[7]:
f, ax = stack.show_histogram()

Show fully transparent pixels and the density distribution.
[8]:
f, ax = stack.show_transparency_estimate()

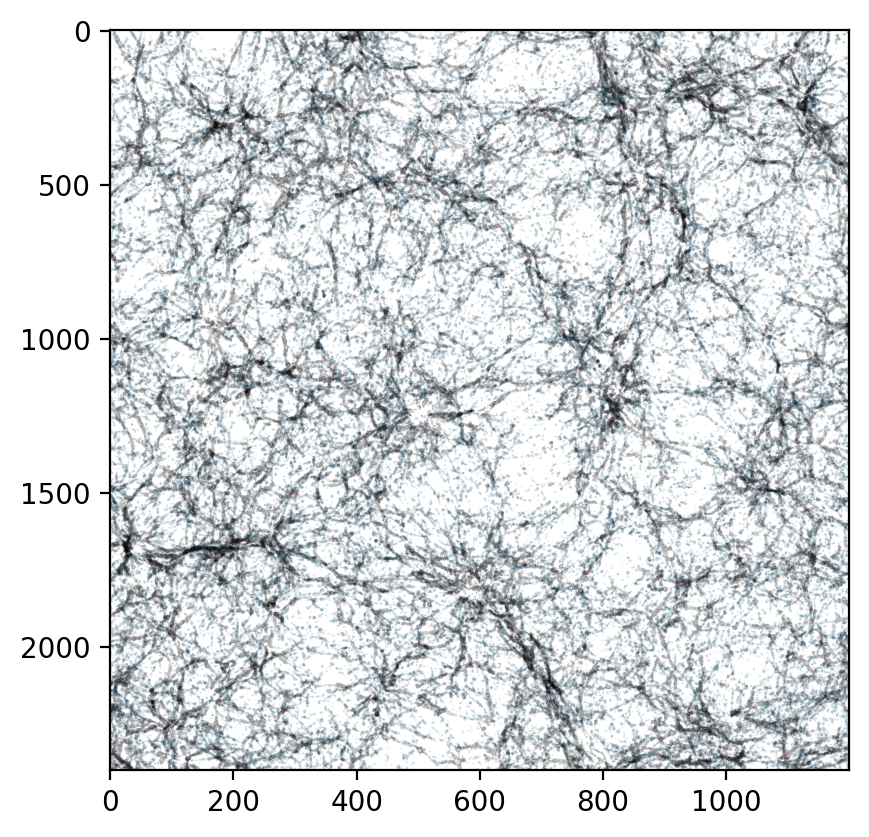
Top view
[9]:
bg = 255
[10]:
stack.show_colors()
[10]:
(<Figure size 400x100 with 1 Axes>, <Axes:>)

[11]:
stack.replace_color(1, 255 * image_stack.VeroC_sRGB)
[12]:
stack.replace_color(3, 255 * image_stack.VeroM_sRGB)
[13]:
stack.show_colors()
[13]:
(<Figure size 400x100 with 1 Axes>, <Axes:>)

[14]:
f, ax = stack.show_top_view(bg=bg)

3 Sides
[15]:
#%%time
# this might take long
# f, ax = stack.three_views(bg=bg)